Climate resilience in the Gold Coast water plan area
There have been many updates to weather patterns, forecast models and climate data since the current Gold Coast water plan was established in 2006.
We have reviewed if and how water availability has changed since 2006.
Technical assessments have been done to evaluate the risk of climate variability to water availability in the plan area.
Learn how we manage climate variability risks.
Queensland’s water plans in a variable and changing climate report (PDF, 19.0MB) identifies climate impacts across each of the water plan areas. For example, pages 52 and 53 show the below snapshot of observed and projected climate trends for the Gold Coast water plan area.
The snapshot includes 2 scenarios represented by a representative concentration pathway (RCP) of 8.5 (high greenhouse gas emissions) and 4.5 (lower greenhouse gas emissions) for the years 2030 and 2050. They indicate:
- average daily temperatures are projected to increase between 0.9 and 1.6 degrees centigrade
- average annual rainfall could increase in 2030 by 6% and decrease by 1% by 2050 in the high emissions scenario
- average annual potential evapotranspiration (PET) is projected to increase between 5% and 12%.
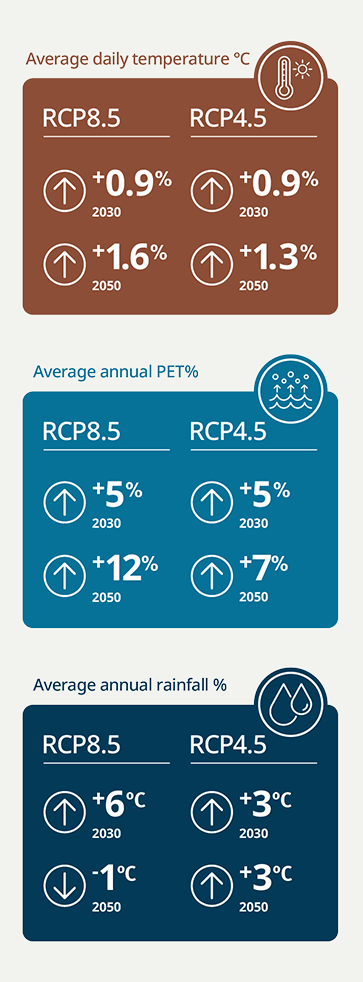
Observed and projected climate trends in the Gold Coast water plan area